Appearance
Configure curves
Qt StripTool has ten curve slots. The graph and Controls windows use the same configuration, so edits in Controls affect acquisition and rendering immediately.
Curve rows
Enter a name in an unused row or use the PV field and Connect. Each row controls plotting, linear or base-10 logarithmic scale, precision, minimum, maximum, and color. Select Modify to apply row edits. Remove frees the slot and stops acquisition.

Auto Scale is graph-wide and fits every plotted curve to its visible data. Reset View returns curves to the limits shown in Controls. A curve added later follows the active mode. For log curves, choose positive limits; non-positive samples cannot appear on a base-10 axis and create a gap.
Timing and appearance
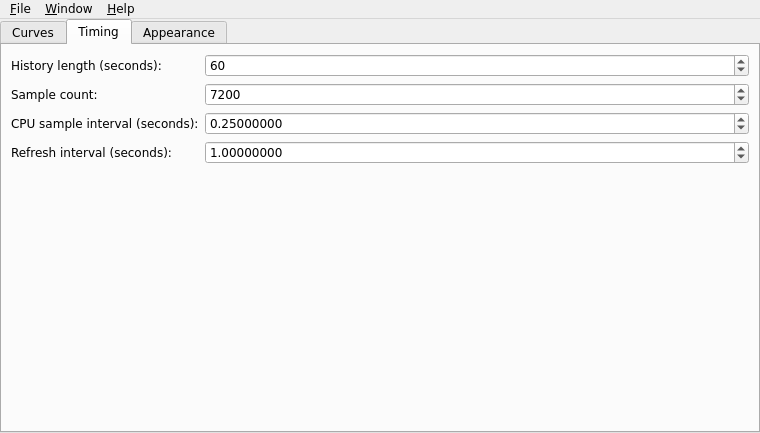
The Timing tab sets history length, bounded sample count, the local CPU_Usage sampling interval, and a separate display refresh interval. Channel Access curves record monitor updates when delivered; their values are not resampled by that interval. CPU_Usage is a local pseudo-curve and does not open a Channel Access subscription.
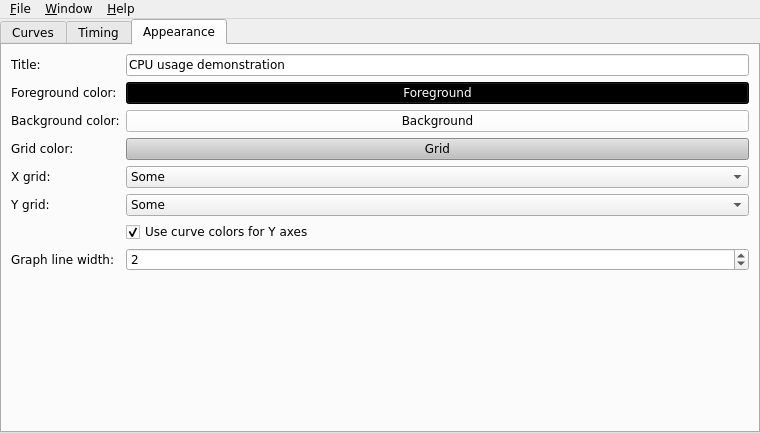
The Appearance tab sets graph colors, grid density, colored Y axes, and line width. Each curve has its own color. The graph uses step traces for both linear and logarithmic curves.
Settings supported by the legacy format are saved in .stp files. Configuration files lists the fields and current limits.