Appearance
Read and navigate the graph
The graph plots timestamped monitor values as step lines. A vertical axis can be colored for its curve; the legend beside the plot shows visible curve names and latest values.
Read time and values
Each X-axis tick has relative minutes above local clock time. The rightmost relative label is zero; earlier ticks are negative. With auto-scroll enabled, the right edge follows the latest time. With auto-scroll off, it marks the end of the fixed visible range.
Move the pointer over the plot to update the location readout. Click a legend entry to read that curve's value at the pointer location.
Navigate
The View menu can pause time scrolling, toggle auto-scroll, pan in time or value, zoom either axis, auto-scale, reset, clear data, and force a replot. The toolbar has arrows for panning, X+/X− for time zoom, and Y+/Y− for value zoom. Right click a toolbar Pan or Zoom button for a smaller step. Drag empty plot space with the left button to pan.
Vertical zoom uses logarithmic units for Log 10 curves. Auto Scale fits visible data; Reset View restores configured limits and the time view.
Annotate an event
Right click the graph and choose Annotate Here to add a note at that time and value. Double click an annotation to edit it, or double click empty plot space to add one. Left click a box to select it; hold the middle button to move it. Delete or Backspace removes the selected annotation.
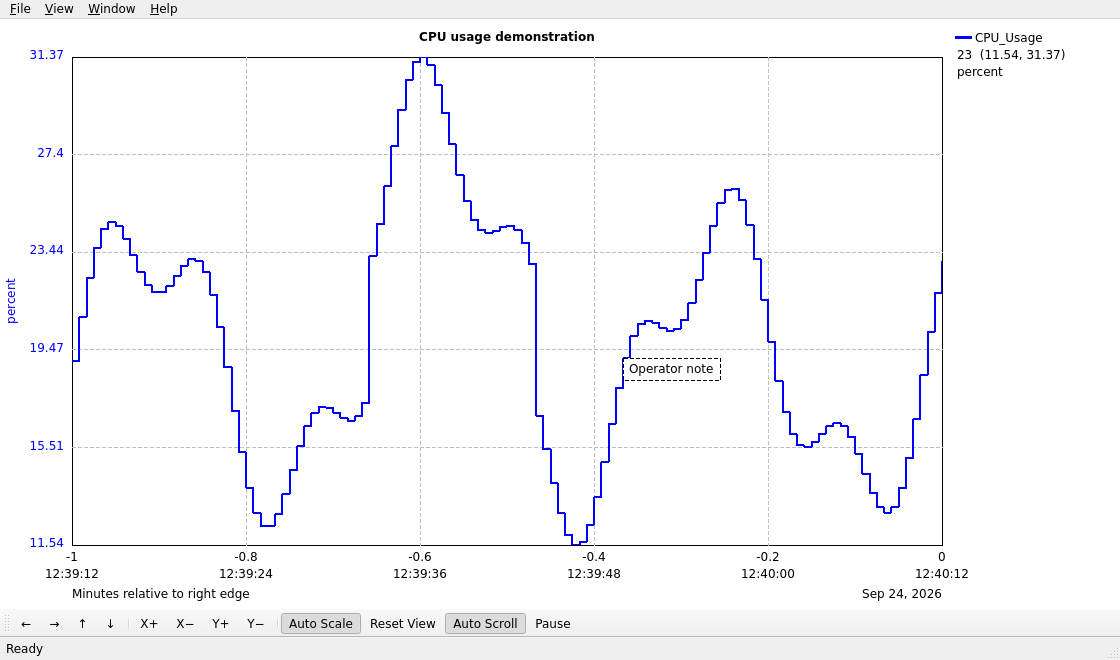
Annotations are runtime graph state and are not saved in .stp files. Use snapshot export if you need an image of the annotated plot.